K. WOODWARD PERSONAL FINANCE
  • Start
  • Bio
  • WealthBlog
    • Books
    • Random Thoughts
    • Femail
    • GirlBanker
  • MyBooks
  • MoneySpot
  • Coach

Q&A: Do I spend more money than the average person?

18/4/2020

0 Comments

 
​Hi Heather,
 
My name’s Reena, I’d really like to know what my spending looks like relative to the average person, can you do a blog post or podcast episode on that?
 
Thanks.
Picture
The Money Spot™ - UK Personal Finance · #16 Do I spend more money than the average person?
Great question Reena. At some point, everyone wonders: how do other people spend their money? Do I spend much more money on food or eating out or rent than other people?
 
Well, we keep pretty good records of this in the UK so this is what I found out from the office of national statistics website, hereafter, I’ll just call them the ONS:
 
The numbers on spending can change a fair amount from one year to the next. The ONS releases a report of the UK’s household spending each year. For 2015/16 the average household spent c.£530/week, in 2016/17 it moved to about £537/week and in 2017/18 despite all the Brexit drama it shot up to £573/week. That it’s the highest it’s been since 2005.
 
£573/week translates to £2,483/month per household. Basically, if your household spends more than £2,500/month before accounting for the portion of your mortgage that pays off the mortgage debt, then you spend more than the average household. This rate of spending translates to just under £29,800/year but median household income was about £29,000 in FYE 2018 so spending slightly outstripped earning – no mega news there.
 
Average household size in the UK has remained at 2.4 people for over the decade – so it’s pretty stable.
 
An interesting factor about spending is that it can frequently bear little relation to earnings so some people spending this amount will be relatively well off and could spend more but they choose to live beneath their means and some people spending at this level will be persistently spending more than they earn by taking on debts, e.g. by renting cars via leases or buying them via hire purchase agreements and so on.
 
Threes notes for you:
  1. I am rounding these numbers up to the next £ for simplicity;
  2. To get ‘per month’ figures from weekly figures I multiple by 52 and divide by 12, I don’t multiply by 4;
  3. Most importantly, note that these figure do not include mortgage capital repayments only the interest portion of a mortgage payment. I found that a little strange too but, hey ho!
To get this out the way note that the average weekly mortgage payment by mortgage holders was £156.50 in the financial year ending (FYE) 2018, accounting for almost an eighth (13%) of all mortgage holders’ expenditure – this amounts to £678/month.
 
Sidebar: the UK financial year starts on 1 April and ends on 31 March and the tax year starts on 6 April every year and ends on 5 April…
 
In the FYE 2018:
  • transport,
  • followed by housing,
  • fuel and power (excluding mortgages),
  • recreation and culture
were the expenditure categories with the highest average weekly expenditure in the UK.
 
TRANSPORT
 
In 2017/18 households spent £81 a week on average on transport – that’s about £350 per month.
 
HOUSING
 
The average UK household spent £217/month on housing and if you deduct housing benefit and related allowances this was only £156/month.
 
Utility costs per month were:
Electricity, gas and other fuels:                   £98
Water                                                            £40
Maintenance and household repairs          £36
 
Total to housing is therefore:  £330/month (156+ 98+ 40 +36)
 
FOOD
  • In 2017/18 the amount that an average household spent on all food and drink, including alcoholic drinks and food eaten out was £45/week. (gov.uk)
  • Household food and non-alcoholic drink purchases formed the largest share at £28 per person per week.
  • Only £4 was spent on household alcohol per person per week.
  • Food and non-alcoholic drink purchases eaten outside the home were £11 per person per week.
  • On average, households spent 10.6% of their income on food but this rose to 15% for the poorest 20% of household.
 
What this says to me is that if you are a teetotal household of 2 grown children aged 18+ and 2 parents you can expect to spend £153/week {(27.54+10.65)*4} on food and drink at home and in restaurants, i.e. about £660/month. Alcohol consumption increase that to £785/month – so alcohol adds about £125/month to our 4 person household of 2 grown children and 2 parents.
Picture
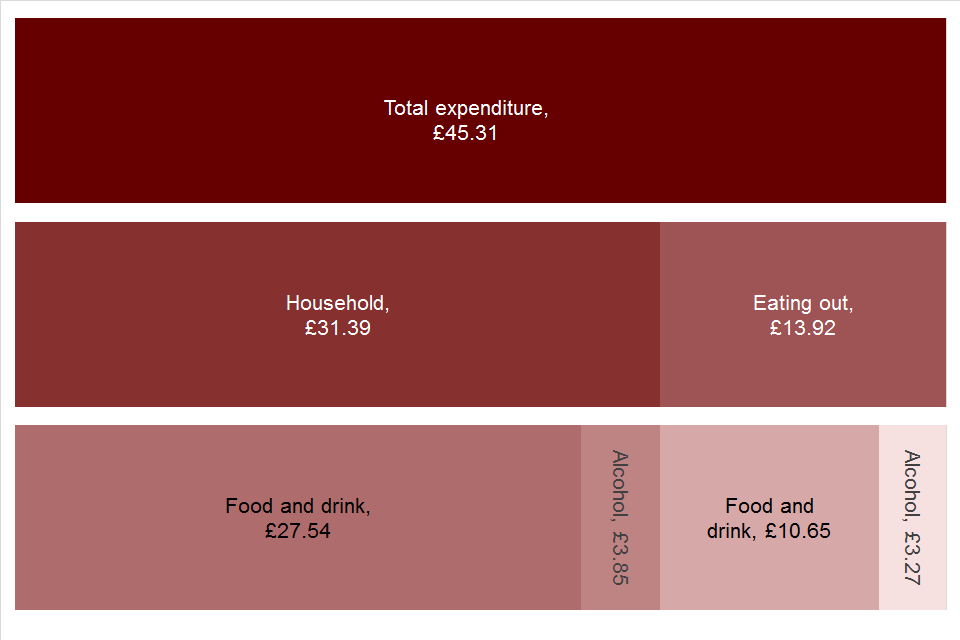
Household food and drink expenditure per week
Really interesting, these stats suggests that our family should be spending £660/month but we frequently spend about half of this. The only month when we spent close to this is December when we spend £661 which is scarily bang on average. Outside of this mega month we’ve spent £190/month in our cheapest month and £330/month in the highest month outside of December and our food spend includes basic personal care stuff like roll-on and body wash which the ONS food spend number does not include.
 
Moving on…
 
If you’re a teetotal average couple (i.e. no kids) you’re spending about £76/week on food at home and eating out, i.e. about £330/month increasing to close to £400/month if you buy alcohol.
 
If you have two young children I’d count them as one and you should expect to spend £115/week on food and drink at home and in restaurants or about £500/month – this increases to about £590 per month if you spend money on alcohol.
 
RECREATION AND CULTURE
 
You know you are living in a privileged country when recreation and culture can fall into the top 4 spending categories. In fact, recreation and culture was the highest spending category for households in the North East and Scotland where it made up 16% and 14% of their spending, respectively. This was apparently driven by a few different factors, such as lower spending on transport and housing.
 
Now, rather than give a narrative on each category, I will recommend you look at the table that I have compiled for you using the pretty awesome ONS website and see how the UK is spending.
 
I’ll reel off the top numbers for you which I have split into weekly, monthly and annual spending so you can look at the metric that’s more relatable to you – some people work by the week, I prefer seeing things by month and year.
                                                            Weekly           Monthly          Yearly
Mortgage (for owners)                     157                 678                 8,138
Rent (for renters)                             108                 467                 5,606
 
Transport                            
Personal transport                            33                   144                 1,726
Purchase of vehicles                         28                   121                 1,451
Public transport                                20                   85                   1,024
 
Housing (net), fuel and power                            
Rentals net of benefits                     36                   156                 1,877
Maintenance and repair                  8                      36                   426
Gas bill                                                10                   42                   510
Electricity bill                                     11                   49                   593
Other fuel                                          1                      6                      68
Water bill and misc.                          9                      40                   484
 
Other expenditures                        
Council tax, mortgage interest         47                   202                 2,423
Charity, cash gifts                              14                   59                   712
Holiday spending                              12                   54                   645
Licences, road tax, fine                     4                      16                   192
 
Food and drink                   
Food + alcohol-free drinks               61                   263                 3,151
Restaurants / catering                     39                   168                 2,018
Hotels                                                 11                   47                   567
Alcoholic drinks                                 9                      38                   452
Tobacco and narcotics                      4                      16                   198
 
Recreation and culture                             
Package holidays                               27                   117                 1,399
TV+ video subscriptions                   7                      30                   364
Newspapers, books, etc                    5                      23                   276
Cinema, theatre, museums              3                      13                   161
Other recreation, e.g. photos            32                   140                 1,680
 
Households goods and services                         
Furniture, carpets, floor                   23                   98                   1,175
Routine household maintenance    7                      29                   348
Household appliances                      4                      19                   224
Tools/equipment                              3                      13                   151
Household textiles                            2                      10                   114
Crockery and cutlery                        2                      8                      99
 
Miscellaneous goods and services                                 
Insurances                                         18                   76                   915
Personal care                                     13                   54                   650
Bank fees, moving house, other       5                      22                   265
Personal effects                                4                      17                   208
Childcare related                              4                      19                   229
Clothing and footwear                     24                   105                 1,264
Internet bill / spend                          4                      16                   198
Telephone, fax, post office                14                    61                   733
Hospital / medical                             7                      30                   359
Education                             
Education fees                                   8                      36                   426
Secondary education                        0                      1                      10
Nursery and primary education       0                      1                      10
TOTAL                                             £572.6           £2,481           £29,775
I spent some dedicated time on the top things people spend money on to figure out how much is being spent according to a variety of sources; one of the sources I stumbled upon was the results of a survey carried out by powershop.co.uk on 2,000 people:
 
Interesting findings from the powershop survey include that 23% of households have a running direct debit for something they don’t use or need. This could be anything from a gym membership to a subscription to a streaming service such as Netflix.
 
They also found that 20% of households delay switching energy suppliers even though it could save them up to £300 each year.
 
How people spend their free time
 
I also found it interesting to look up statistics to find out how the average person spends their time. This is very closely related to the question on how people spend their money.
 
I found it extra interesting because I always wonder how everyone watches so much more TV than I do.
 
For the UK:
  • 35.5% of time is spent working and commuting
  • 28% of time is spent sleeping
  • 24% of time is spent undertaking leisure or personal care activities
  • 12.5% of time is spent on unpaid work and miscellaneous tasks
 
So, 5.8 hours a day is spent on leisure and personal care. However, this masks a gender discrepancy as the average man has half an hour more free time than the average woman – 6.1 hours vs. 5.5 hours. The average American has about as one hour less leisure time than the average Briton at about 5 hours. Again American men spend more time engaged in leisure activities (5.8 hours) than did women (5.1 hours).
Picture
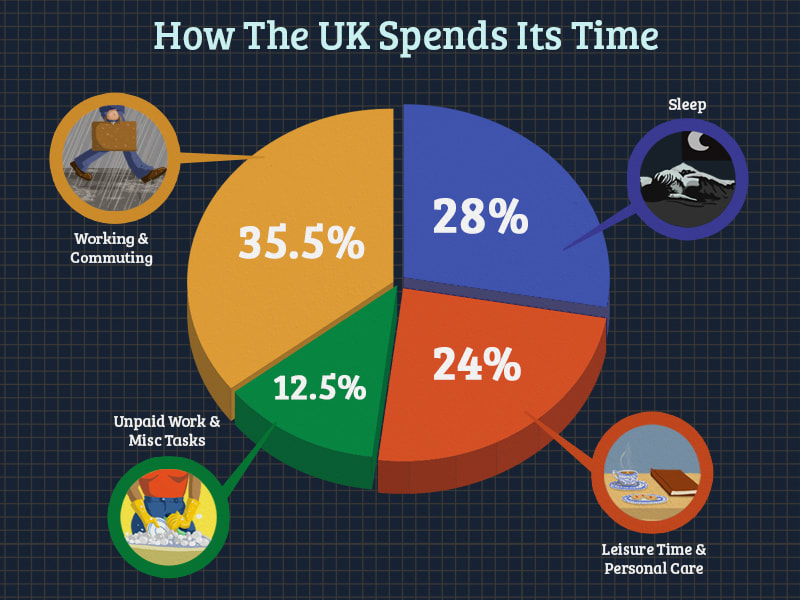
And the top 5 leisure activities are:
  • TV, music and reading;
  • Sports and outdoors pursuits;
  • Eating out;
  • Socialising, i.e. nights out; and
  • Relaxing activities like hobby crafts.
 
Key takeaways:
  1. Look at how much the average household spends on different categories to help you figure out where you might be able to cut back;
  2. Cancel direct debits for things you don’t use;
  3. Sign up to a service like lookaftermybills.com to save on electricity and gas without the hassle;
  4. Remember, reducing expenses is only one side of the equation when it comes to building your net worth – you can also work on increasing your income with those 6 hours of free time you have e’ryday!
 
I hope this helps!
Heather
0 Comments

    RSS Feed

    Heather on Wealth

    I enjoy helping people think through their personal finances and blog about that here. Join my personal finance community at The Money Spot™.

    Categories

    All
    4% Rule
    About
    Accounting
    Action
    Admin
    Airbnb
    Amazon
    Ask Heather Katsonga
    Assets
    Attitude
    Beauty Industry
    Black Culture
    Black Economics
    Branding
    Budgeting
    Business Cash Flow
    Buy To Let
    Careers
    Cars
    Cash Flow
    Change
    Children
    Content Creation
    Credit Karma
    Credit Score
    Critical Illness Cover
    Dave Ramsey
    Decreasing Term Insurance
    Defined Benefit Pension
    Diversification
    Earning More Money
    Ebay
    Education
    Emergency Fund
    Energy
    Entrepreneurship
    Equity Release
    Estate Planning
    Etsy
    Experian
    FAQs
    Fear Of Risk
    Fidelity
    Financial Crisis
    Financial Freedom
    Financial Independence
    Financial Planning
    FIRE Movement
    Freelance
    Graphics Design
    Habits
    Halifax
    Hargreaves Lansdown
    Health
    Implementation
    Income
    Initiative
    Insurance
    Investing
    ISA
    Iweb
    Jobs
    Junior ISA
    Legacy Business
    Liabilities
    Life Insurance
    Life Story
    Lodger
    Luck
    Mindset
    Mompreneur
    Money
    Money Mistakes
    Money Spot Program
    Mortgage Insurance
    Mortgages
    Net Worth
    Nurture
    Office Of National Statistics
    Online Selling
    Opportunity
    Organisation
    Parents
    Passion Business
    Patience
    Pensionbee
    Pensions
    Personal Balance Sheet
    Planning
    Poverty
    Priorities
    Priority
    Productivity
    Property
    Racism
    Refunds
    Relationships
    Rental Insurance
    Renting
    Resources
    Retirement
    Risk Taking
    Rule Of 72
    Sacrifices
    Saving
    Self Discovery
    Self Employed
    Self-Improvement
    Side Hustles
    Single Parent
    SIPP
    Sleep
    Social Norms
    Spending
    Stamp Duty
    Start Up
    Start-up
    Stay At Home Parent
    Stock Market
    Tax
    Teenagers
    Time
    Unemployment
    Vanguard
    Wage Slavery
    Wealth Protection
    Will Power

    Archives

    December 2022
    October 2022
    September 2022
    July 2022
    June 2022
    May 2022
    November 2021
    December 2020
    November 2020
    October 2020
    September 2020
    August 2020
    July 2020
    June 2020
    May 2020
    April 2020
    March 2020
    February 2020
    January 2020
    December 2019
    May 2019
    June 2018
    November 2016
    September 2016
    August 2016
    July 2016
    June 2016
    February 2016
    January 2016
    September 2015
    August 2015
    July 2015
    June 2015
    May 2015
    April 2015
    March 2015
    February 2015
    January 2015
    December 2014
    November 2014
    October 2014

Picture

Podcast Links

Wealth Blog 

  • Children
  • Financial Independence / FIRE
  • Pensions
  • Retirement
  • Saving
Buy me a coffeeBuy me a coffee
Picture

© 2007 - 2021, The Money Spot™ ~ Make Money, Change Lives!
Heather Katsonga-Woodward, a massive personal finance fanatic.
** All views expressed are my own and not those of my employer ** Please get professional advice before re-arranging your personal finances.
Photos used under Creative Commons from Got Credit, www.hickey-fry.com, focusonmore.com, Francisco Anzola, SortedForYa, Prachi More, osipovva, Got Credit, focusonmore.com, Free For Commercial Use (FFC), Cory M. Grenier, jerseytom55, Got Credit, wuestenigel, trendingtopics, EpicTop10.com, mikecohen1872, mrmatthogg, focusonmore.com, jijake1977
  • Start
  • Bio
  • WealthBlog
    • Books
    • Random Thoughts
    • Femail
    • GirlBanker
  • MyBooks
  • MoneySpot
  • Coach