K. WOODWARD PERSONAL FINANCE
  • Start
  • WealthBlog
  • MyBooks
  • MoneySpot
  • Coach
  • Contact

Random Thoughts

Children and Body Mass Index

3/3/2012

0 Comments

 
By Dr Harry
​
The body mass index (BMI) can be calculated by using a formula which relates your weight to your height. The result, a number, can be interpreted to give you an idea of whether you are overweight or obese.

We use the same formula – weight in kilograms divided by height in meters squared – to calculate a child’s BMI. However when interpreting your child’s BMI you must be careful to take into account the child’s exact age and use an appropriate BMI chart for their gender.

The chart below is an example. This chart - produced by the Child Growth Foundation - is for the UK population based on the latest data (collected in 1990).
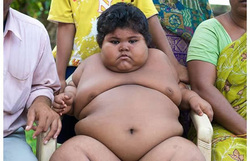
Picturehealthaglobalissue.blogspot.com
​We can use this chart to plot a BMI value according to a child’s age and therefore discover whether the BMI value means that the child is underweight, normal overweight, or obese.

The normal range changes depending on the age of the child. 
So, for example, a BMI of 20 is considered severely obese at age 2 but normal at age 16.

The importance of discovering obesity in a child is related to the connection between many diseases and obesity. Usually the child has simple nutritional obesity – that is obesity as a result of imbalance between number of calories taken in and number of calories burnt.

But sometimes, a child will have a medical reason (e.g. a genetic or endocrine cause) for their obesity and the sooner this is discovered, the sooner treatment can get underway.

So in summary,
  • You cannot interpret a child’s BMI without having the BMI charts to refer to.
  • The normal range changes according to the child’s age and gender.
  • Although nutritional obesity is the most common cause of childhood obesity, obesity may be a symptom of an underlying illness. This can be investigated by a doctor and appropriate treatment directed at the underlying illness may alleviate the obesity.
You can download the BMI charts for boys and girls by clicking the link below. The shaded area (pink on the girls' chart and blue on the boys' chart) is considered a normal BMI. The topmost bold curve indicates the obese cut-off. The bold curve below it indicates overweight. The thin black curves below the 'normal' area represent underweight. The lower the curve the more underweight or malnourished the child is. 

Rather than give lots of examples, I think it would be more interesting for you to download the charts and analyse where you think your own child is. If you have any questions, feel free to get in touch.

children_body_mass_index_charts.pdf
File Size: 1389 kb
File Type: pdf
Download File

Picture


​Although your personal finances and your business success are my primary interest, I believe you only operate at peak efficiency when you're fit and healthy. If you feel good, it filters through to your work. To help you with that, click for your free ebook: The Quick Guide to Sexy
​

0 Comments


Leave a Reply.

    RSS Feed

    By Heather
    ​Katsonga-Woodward

    I'm always thinking, debating, considering and revising my views - some of those deliberations will be shared right here.

    Categories

    All
    6 Figure+ Business Course
    Baby
    Baby Shower
    Celebrity Lives
    Culture
    Days Out & Holidays
    Diy
    Economic Development
    Education
    Entrepreneurship
    Fashion
    Films
    Food
    Getting To Wealthy
    Healthy Weight
    I Just...
    Life Is...
    Malawi
    Moral Hazard
    Parenting
    Personal Finance
    Politics
    Productivity
    Property
    Psychology
    Retirement
    Social Progress
    Spirituality
    Technology
    Weight Issues
    Women Issues

    Archives

    June 2017
    January 2017
    December 2016
    October 2016
    July 2016
    November 2015
    June 2015
    February 2015
    November 2014
    October 2014
    August 2014
    June 2014
    April 2014
    March 2014
    February 2014
    January 2014
    December 2013
    November 2013
    October 2013
    September 2013
    August 2013
    July 2013
    June 2013
    May 2013
    March 2013
    February 2013
    January 2013
    December 2012
    November 2012
    October 2012
    September 2012
    August 2012
    July 2012
    June 2012
    May 2012
    April 2012
    March 2012
    February 2012
    January 2012
    December 2011
    October 2011
    September 2011
    August 2011
    July 2011
    June 2011
    May 2011
    April 2011
    March 2011
    November 2010
    October 2007
    January 2007


© 2007 - 2025 Heather Katsonga-Woodward, a massive personal finance fanatic.
** All views expressed are my own and not those of any employer, past or present. ** Please get professional advice before re-arranging your personal finances.
  • Start
  • WealthBlog
  • MyBooks
  • MoneySpot
  • Coach
  • Contact